Ways to view Weld Lines in Moldflow Insight
Did you know there are multiple ways to view and identify weld lines in Moldflow Insight?
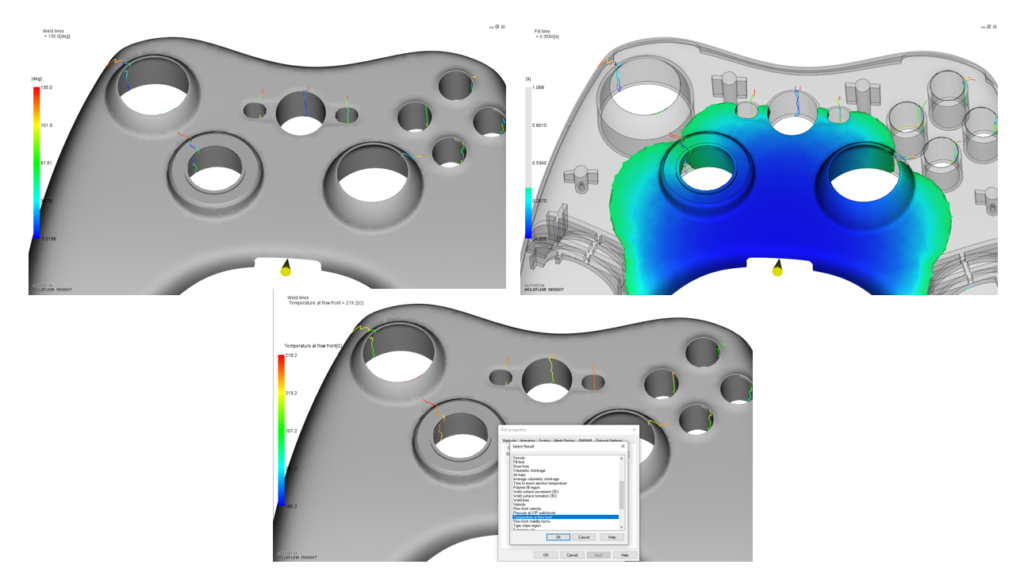
Anytime you look at a plot, I encourage you to pay close attention to the units. The Weld lines plot shows the units as (deg) however this is not a temperature degree. This degree shows the angle formation of the weld line. Blue weld lines with a lower degree of formation would be a weaker “butt weld” while weld lines in red would be a higher degree of formation, closer to a “meld line”.
With weld lines, I prefer to also overlay the Fill time plot so I can better highlight how the filling pattern is causing the weld line to form. You can do this by ensuring the weld line plot is on, then go to Fill time in the Study Tasks – right click and overlay. Fun fact, the 2nd plot you overlay is the one that can be animated.
You can also show the weld line plot as Pressure, Temperature, Viscosity, or Shear Rate by going into Plot Properties – Highlight tab – Select a different plot.
3D meshes would have 2 additional plots to view lines, Weld surface formation (3D) and Weld surface movement (3D).
How do you evaluate weld lines in Moldflow?


